1. Why data separates scaling businesses from stagnant ones
Most businesses are not short of data — they are short of decisions made with it. Sales sits in a CRM, marketing sits in ad platforms, finance sits in accounting software, and nobody joins the three together. The result is a leadership team guessing at questions the numbers could answer in minutes.
Data-driven growth is simply the discipline of measuring what actually moves revenue, reviewing it on a fixed rhythm, and reallocating budget and effort towards what works. It is less about dashboards and more about the habit of asking 'what does the evidence say?' before spending the next pound.
- Faster, cheaper decisions with less internal debate
- Budget shifted from underperforming to proven channels
- Earlier warning when pipeline or retention slips
- Realistic forecasting instead of optimistic guesswork
2. Start with the handful of KPIs that actually matter

Vanity metrics — impressions, followers, raw sessions — feel productive and change nothing. The metrics that drive growth are the ones tied directly to revenue and to the cost of earning it.
Pick five to seven, define exactly how each is calculated, and do not change the definitions every quarter. Consistency is what makes a trend readable.
- Cost per qualified lead (CPQL)
- Lead-to-customer conversion rate
- Customer acquisition cost (CAC)
- Average order value or contract value
- Customer lifetime value (LTV) and LTV:CAC ratio
- Retention or repeat purchase rate
- Pipeline velocity — how fast deals close
3. Fix attribution before you judge any channel
Nearly every business we audit is under-crediting at least one channel and over-crediting another. Last-click reporting rewards whatever the buyer touched at the end — usually branded search — while the content, social and referral activity that created the demand looks worthless.
You do not need a perfect model. You need a defensible one: server-side tracking or consent-aware GA4, UTM discipline on every link, a 'how did you hear about us?' field on your forms, and CRM stages that record the true first touch. Combine self-reported attribution with platform data and you will get close enough to make good budget calls.
- Standardised UTM naming across all campaigns
- GA4 configured with real conversion events, not pageviews
- Self-reported source captured on every enquiry form
- Offline and phone leads logged back into the CRM
- Monthly channel review against CPQL, not clicks
4. Turn customer data into segments, not spreadsheets
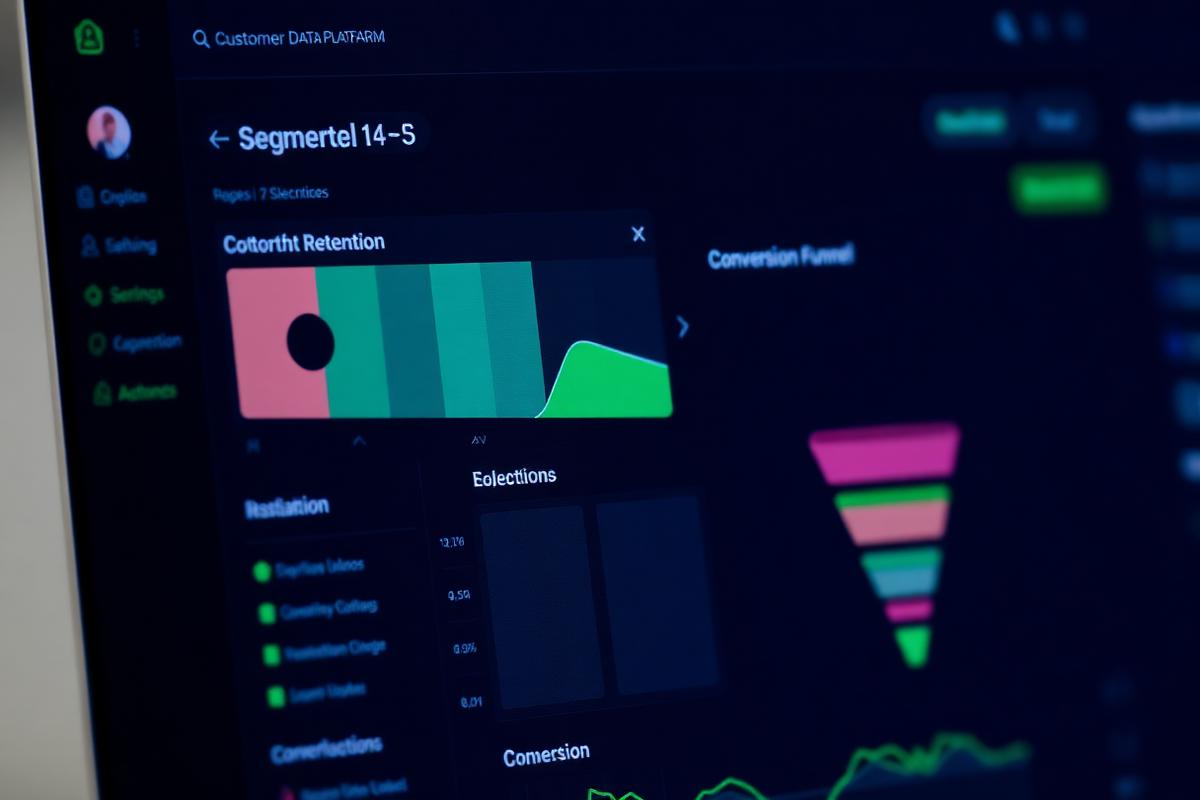
The fastest growth usually comes from serving your best existing customers better, not from finding entirely new ones. That requires segmentation: grouping customers by value, sector, service line, recency and behaviour, then treating each group differently.
Cohort analysis is the other half. Track how each month's new customers behave over time and you can see whether product, service or onboarding changes are genuinely improving retention — something an overall average will always hide.
- High-value accounts worth proactive account management
- Dormant customers ripe for reactivation campaigns
- One-off buyers who could move to retainer
- Sectors with the strongest margin and shortest sales cycle
5. Build one dashboard your leadership team actually opens
A dashboard nobody reads is worse than no dashboard, because it creates the illusion of oversight. Build one view that answers three questions: are we generating enough demand, are we converting it efficiently, and are we keeping what we win?
Keep it to a single screen. Show trend lines, not snapshots. Add a target alongside every metric so the number carries a verdict, not just a value. Then set a fixed weekly or monthly review where decisions get made from it.
- One screen, five to seven metrics, clear targets
- Rolling 12-month trends rather than month-on-month noise
- Automated data refresh — no manual spreadsheet exports
- A named owner for every metric
- A recurring review meeting with actions logged
6. Run small experiments instead of big bets
Data's real value is that it lets you be wrong cheaply. Rather than committing a quarter's budget to a new channel, run a structured test: define the hypothesis, the sample size, the success metric and the decision you will make either way — before it launches.
Conversion rate optimisation works the same way. Test headlines, form length, pricing presentation, page speed and calls to action one variable at a time. A 20% lift in landing page conversion is usually cheaper to win than a 20% increase in traffic.
- Hypothesis written before the test starts
- One meaningful variable changed at a time
- Success metric and time window agreed up front
- Results documented so learnings compound
7. Use data to forecast, not just to report
Reporting tells you what happened. Forecasting tells you what to do next. Once you have twelve months of consistent pipeline and conversion data, you can model revenue with reasonable confidence: leads required, conversion rate, average value and sales cycle length give you a working revenue engine.
That model turns marketing spend into a planning input rather than a cost line. If you know a qualified lead costs £85 and one in five closes at £4,000, the case for investment writes itself.
8. How to get started in the next 30 days
You do not need a data team or expensive software to begin. Most UK SMEs can build a genuinely useful measurement foundation in a month using tools they already pay for.
- Week 1 — Agree your five core KPIs and their definitions
- Week 2 — Fix tracking: GA4 events, UTMs, CRM source field
- Week 3 — Build one leadership dashboard with targets
- Week 4 — Hold the first review and pick one experiment